
In the fast-evolving landscape of professional basketball, the traditional box score, while foundational, is no longer sufficient to fully grasp the nuances of player performance and team strategy. As we look towards 2026, the integration of advanced basketball metrics has become paramount, offering insights that provide a crucial 10% edge in decision-making, player evaluation, and game planning. This isn’t just about counting points, rebounds, and assists anymore; it’s about understanding the ‘why’ and ‘how’ behind every action on the court. The modern game demands a deeper, more analytical approach, and those who embrace these advanced basketball metrics will undoubtedly be the ones hoisting championship trophies.
For years, basketball analysis relied heavily on easily quantifiable statistics. A player’s points per game, field goal percentage, and free throw percentage were the bedrock of evaluation. While these stats still hold value, they paint an incomplete picture. They fail to account for defensive impact, playmaking that doesn’t result in an assist, screen assists, gravity, or the sheer volume of possessions a player is involved in. This is where advanced basketball metrics step in, providing a microscopic view of the game, revealing hidden efficiencies and inefficiencies that can make or break a season. The shift from anecdotal observation to data-driven insights has transformed coaching, scouting, and even fan engagement, making the game richer and more strategically complex.
Anúncios
The competitive nature of basketball today means that every marginal gain is sought after. A 10% edge might seem small, but in a game often decided by a single possession, it’s monumental. This article delves into five advanced basketball metrics that are not only gaining traction but are set to revolutionize basketball strategy by 2026. These metrics go beyond the surface, offering a profound understanding of player value and team cohesion. Whether you’re a coach looking to optimize your lineup, a scout searching for undervalued talent, or a passionate fan wanting to understand the game at a deeper level, these insights will be invaluable. Let’s explore how these cutting-edge analytics are reshaping the future of basketball.
True Shooting Percentage (TS%): The Efficiency Mastery
True Shooting Percentage (TS%) is one of the foundational advanced basketball metrics, and its importance continues to grow. While field goal percentage (FG%) and three-point percentage (3P%) give us a good idea of a player’s shooting accuracy, they don’t account for the value of free throws. TS% adjusts for all three scoring events – field goals, three-pointers, and free throws – to provide a comprehensive measure of a player’s scoring efficiency. The formula is simple yet powerful: Points / (2 * (Field Goal Attempts + 0.44 * Free Throw Attempts)). The 0.44 factor adjusts for the fact that free throws typically come in pairs, and sometimes a foul results in an ‘and-one’ opportunity, effectively making a free throw attempt worth less than half a field goal attempt in terms of possessions.
Anúncios
Why is TS% so crucial for gaining a 10% edge? Because it tells you how efficiently a player converts their scoring opportunities into points, regardless of the shot type. A player might have a lower FG% but a higher TS% if they get to the free-throw line often and convert at a high rate. Conversely, a player with a high FG% but who rarely draws fouls or shoots poorly from the line might have a lower TS%. In 2026, teams are increasingly prioritizing efficient scoring, especially with the ‘3-and-D’ revolution and the emphasis on shot quality. Understanding which players are truly efficient scorers allows coaches to build lineups that maximize offensive output per possession, a cornerstone of modern basketball strategy.
For example, consider two players: Player A shoots 45% from the field, 35% from three, and 75% from the free-throw line, taking 15 shots and 4 free throws per game. Player B shoots 50% from the field, 25% from three, and 85% from the free-throw line, taking 12 shots and 8 free throws per game. A superficial look might suggest Player B is more efficient due to the higher FG%. However, calculating their TS% would reveal a more accurate picture. This metric helps distinguish between high-volume, low-efficiency scorers and those who consistently generate points with fewer possessions, which is invaluable for resource allocation on offense. Teams aiming for that 10% edge will meticulously track and optimize TS% across their roster, understanding that every possession counts.
Player Impact Estimate (PIE): Measuring True Contribution
The Player Impact Estimate (PIE) is an advanced basketball metric developed by the NBA itself, designed to encapsulate a player’s overall statistical contribution to a game. It’s an all-encompassing statistic that provides a snapshot of how much a player contributes to positive game outcomes when they are on the court. PIE measures a player’s total statistical contribution against the total statistical contribution of the entire game. The higher the PIE, the more impactful the player is perceived to be. It considers points, rebounds, assists, steals, blocks, and fouls drawn, while also penalizing for turnovers, missed shots, and fouls committed. This holistic approach makes PIE an excellent tool for understanding a player’s broad impact beyond just their scoring prowess.
In the context of gaining a 10% edge by 2026, PIE offers a distinct advantage because it moves beyond traditional per-game averages to contextualize a player’s performance within the flow of the game. It allows coaches and analysts to identify players who might not always fill up the traditional stat sheet but are consistently making positive contributions across various facets of the game. These ‘glue guys’ or ‘impact players’ are often overlooked by conventional metrics but are vital for team success. A player with a high PIE consistently influences the game positively, even if their box score numbers don’t always jump off the page. This metric helps in identifying undervalued assets and ensuring that team strategies leverage the full spectrum of player skills.
For example, a defensive specialist who consistently secures defensive rebounds, forces turnovers, and provides solid screens might have a modest scoring output but a very high PIE. This indicates their significant, yet often unheralded, contribution to team success. Conversely, a high-volume scorer with a low PIE might be an inefficient player who negatively impacts team play through turnovers or poor shot selection. By analyzing PIE, teams can make more informed decisions about rotations, free agency targets, and draft picks, ensuring they acquire players who truly elevate the team’s performance. This advanced basketball metric is a powerful tool for building a cohesive and impactful roster, directly contributing to that sought-after competitive advantage.

Net Rating: Unveiling Team Efficiency Dynamics
Net Rating is arguably one of the most critical advanced basketball metrics for understanding team dynamics and efficiency. Simply put, it measures the difference between a team’s Offensive Rating (points scored per 100 possessions) and its Defensive Rating (points allowed per 100 possessions). A positive Net Rating means a team outscores its opponents per 100 possessions, while a negative Net Rating indicates they are outscored. This metric is revolutionary because it normalizes for pace, allowing for direct comparison between teams and lineups, regardless of how fast or slow they play. It’s a pure measure of how effective a team or a specific lineup is at winning the possession battle.
The power of Net Rating for achieving a 10% edge by 2026 lies in its ability to pinpoint the most effective lineups and combinations. Coaches can analyze the Net Rating of various five-man units, four-man groups, or even specific two-player pairings to understand which combinations are most successful. This goes beyond the eye test, providing empirical evidence of what works and what doesn’t. For instance, a team might have a star player who puts up impressive individual stats, but if the lineups they are in consistently have a low or negative Net Rating, it signals a deeper issue with team synergy or defensive lapses that need addressing. Conversely, a bench unit might be quietly dominating opponents, and a high Net Rating for that unit would highlight its understated value.
Consider a scenario where a coach is struggling to find consistency. By examining the Net Rating of different rotations, they might discover that a specific combination of players, perhaps one that doesn’t feature all their ‘star’ players, consistently generates a high positive Net Rating. This insight allows for strategic adjustments, optimizing playing time and lineup configurations to maximize overall team efficiency. In an era where every possession is scrutinized, knowing which lineups are most effective at both scoring and preventing points is a game-changer. This advanced basketball metric provides the clarity needed to make data-driven decisions that directly impact win probability, offering a significant competitive advantage in the quest for that 10% edge.
Usage Percentage (USG%): The Ball Dominance Indicator
Usage Percentage (USG%) is an advanced basketball metric that quantifies the percentage of team possessions a player uses while they are on the floor. A ‘possession used’ is defined as ending a possession with a field goal attempt, a free throw attempt, or a turnover. This metric is crucial because it provides insight into how central a player is to their team’s offense. A high USG% indicates a player who frequently initiates or finishes offensive possessions, while a low USG% suggests a more complementary role. It helps to understand the workload distribution and offensive responsibilities within a team, offering a clearer picture than just looking at points per game.
For teams aiming for a 10% edge in 2026, understanding USG% is vital for several strategic reasons. Firstly, it helps in identifying primary offensive creators versus secondary facilitators. A player with a high USG% needs to be incredibly efficient (as measured by TS%) to be a net positive for the team. If a high-usage player is inefficient, they are effectively draining possessions and opportunities from other, potentially more efficient, teammates. Secondly, USG% is critical for roster construction and offensive scheme design. A team needs a balance of high-usage creators and efficient low-usage role players to thrive. Too many high-usage players can lead to offensive stagnation and ‘my turn’ basketball, while too few can result in a lack of offensive firepower.
Think about a team trying to integrate a new star player. Understanding their historical USG% and how it might impact the existing roster’s usage rates is crucial. If the new star has a very high USG%, coaches need to strategize how to redistribute offensive responsibilities without alienating other key players or disrupting established offensive flows. It also helps in identifying potential fatigue issues over a long season; players with extremely high USG% often carry a heavy burden and might be more prone to burnout or injury. By meticulously analyzing USG%, teams can optimize their offensive attack, ensuring that possessions are allocated to the most efficient and impactful players, thereby maximizing their scoring potential and gaining that critical competitive advantage. This advanced basketball metric is a cornerstone of smart offensive planning.
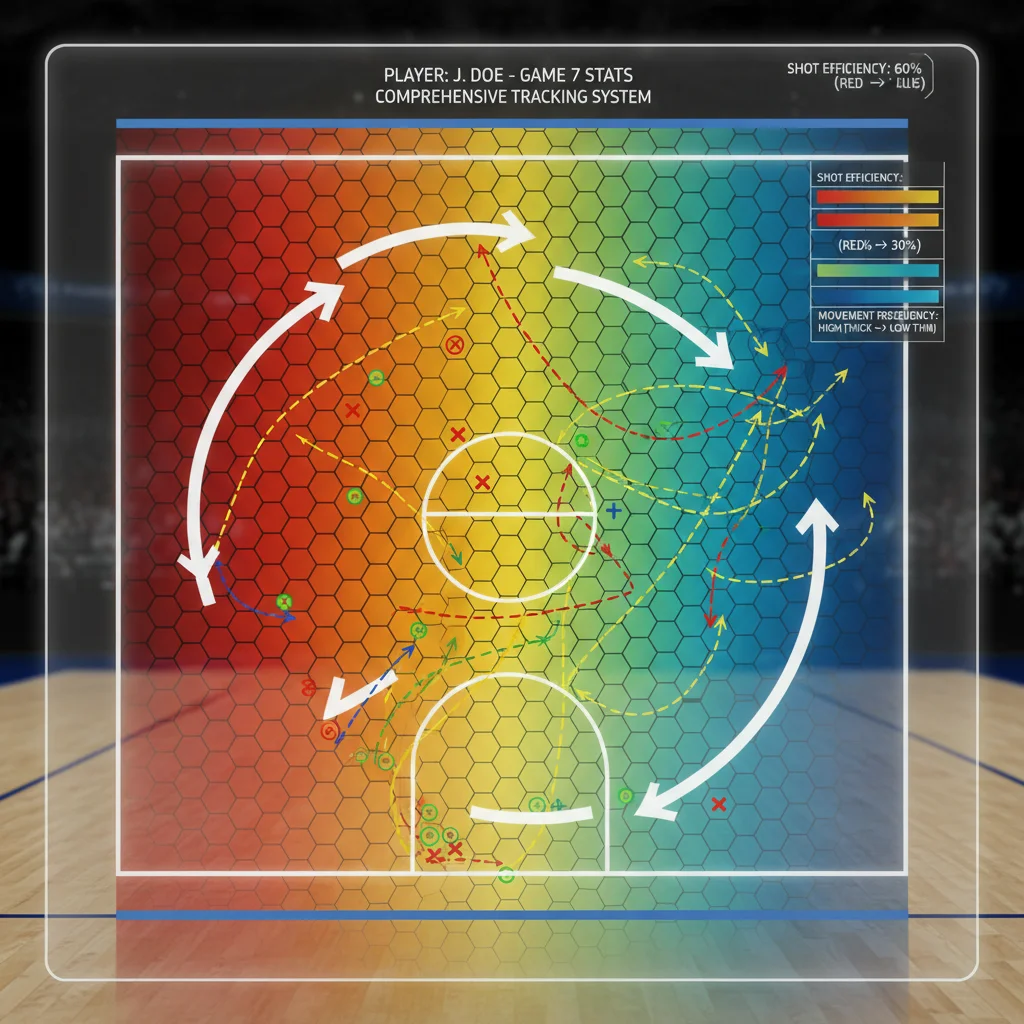
Defensive Box Plus/Minus (DBPM): Quantifying Defensive Impact
Defensive Box Plus/Minus (DBPM) is an advanced basketball metric that estimates a player’s defensive contribution per 100 possessions, relative to an average player. It’s an estimate derived from box score statistics, attempting to quantify a notoriously difficult aspect of basketball to measure: defense. While not perfect, DBPM provides a valuable, albeit imperfect, proxy for defensive impact by considering statistics like steals, blocks, defensive rebounds, and personal fouls. A positive DBPM indicates a player is contributing more defensively than an average player, while a negative DBPM suggests the opposite. It’s a key component of the overall Box Plus/Minus (BPM) metric, which aims to summarize a player’s total value.
The reason DBPM is essential for achieving a 10% edge by 2026 is that defense wins championships, and accurately measuring defensive impact has always been a significant challenge. Traditional defensive stats like steals and blocks only tell part of the story; they don’t account for good positioning, deflections that don’t result in a steal, or the ability to deter shots. While DBPM doesn’t capture all these nuances, it does a better job than raw box score numbers at estimating a player’s overall defensive contribution. It helps identify players who are consistently making a positive defensive difference, even if they aren’t always racking up highlight-reel blocks or steals. In an era where offensive talent is abundant, elite defenders are more valuable than ever.
For example, a player might not have a high block or steal rate, but if their DBPM is consistently high, it suggests they are excellent at defensive rebounding, rarely foul, and are always in good defensive position, forcing opponents into tougher shots. This kind of player is invaluable for a team’s defensive scheme. Conversely, a player with a high block rate but a low DBPM might be gambling too much or committing unnecessary fouls. By leveraging DBPM, teams can make more informed decisions about defensive assignments, identify players who anchor their defense, and build defensive schemes that maximize their roster’s strengths. This advanced basketball metric, while still evolving, provides a critical lens through which to evaluate and optimize defensive performance, directly contributing to that crucial competitive advantage.
Rebounding Rate (REB%): Quantifying Possession Battles
Rebounding Rate (REB%) is an advanced basketball metric that measures the percentage of available rebounds a player or team collects while they are on the floor. It’s broken down into Offensive Rebounding Rate (OREB%) and Defensive Rebounding Rate (DREB%), and then combined for Total Rebounding Rate (TREB%). Unlike simple rebounds per game, which can be skewed by pace and playing time, REB% provides a true measure of a player’s or team’s effectiveness in securing possessions after a missed shot. This metric is fundamental because every rebound is a possession, and winning the rebounding battle often correlates directly with winning the game.
The strategic importance of Rebounding Rate for gaining a 10% edge by 2026 cannot be overstated. Offensive rebounds create second-chance points, which are incredibly efficient and demoralizing for opponents. Defensive rebounds end possessions, preventing those crucial second-chance opportunities for the other team. Teams that consistently win the rebounding battle effectively gain extra possessions and limit their opponents’ scoring chances. By analyzing individual and team REB%, coaches can identify players who are elite rebounders, regardless of their position, and build lineups that maximize their ability to control the boards. This is particularly important in today’s small-ball era, where traditional big men might be less prevalent, making every rebound a contested and valuable commodity.
Consider a team that struggles with offensive efficiency. By focusing on increasing their OREB%, they can generate more possessions and easier scoring opportunities, compensating for a lower shooting percentage. Similarly, a team with a strong DREB% can quickly transition from defense to offense, preventing opponents from resetting their defense. This advanced basketball metric helps in identifying players who might not be high scorers but are crucial for winning the possession battle. For example, a guard with a surprisingly high DREB% can be invaluable for fast-break opportunities. By optimizing Rebounding Rate, teams can gain a tangible advantage in the ebb and flow of a game, directly impacting their ability to control the pace, generate extra scoring chances, and ultimately secure more wins. This is a simple yet profoundly impactful advanced basketball metric for any team seeking a competitive edge.
Conclusion: The Future is Data-Driven
The evolution of basketball analysis from rudimentary box scores to sophisticated advanced basketball metrics represents a paradigm shift in how the game is understood, played, and coached. As we project to 2026, the teams and individuals who master these metrics will undoubtedly hold a significant 10% edge over their competitors. True Shooting Percentage, Player Impact Estimate, Net Rating, Usage Percentage, and Defensive Box Plus/Minus are not just numbers; they are powerful tools that unlock deeper insights into player efficiency, overall contribution, team dynamics, offensive roles, and defensive prowess.
Embracing these advanced basketball metrics allows for a more objective and comprehensive evaluation of talent, leading to smarter roster construction, more effective game plans, and optimized player development. Coaches can identify hidden strengths and weaknesses, scouts can unearth undervalued gems, and players can gain a clearer understanding of how to maximize their impact. The era of relying solely on the eye test is fading; the future of basketball is data-driven, analytical, and precise.
For any organization or individual striving for excellence in basketball, investing time and resources into understanding and applying these advanced basketball metrics is no longer optional – it is essential. The 10% edge is real, and it belongs to those who are willing to look beyond the surface, delve into the data, and leverage insights to push the boundaries of what’s possible on the court. The revolution is here, and advanced basketball metrics are leading the charge towards a more intelligent, efficient, and ultimately, more successful game.