Expected Goals (xG) in American Soccer: A Practical Guide to Interpreting Advanced Analytics for the 2026 Season

Anúncios
Expected Goals (xG) in American Soccer: A Practical Guide to Interpreting Advanced Analytics for the 2026 Season
In the rapidly evolving landscape of modern soccer, traditional statistics like shots on target or possession percentages are increasingly being supplemented, and in some cases, overshadowed, by more sophisticated metrics. Among these, Expected Goals (xG) stands out as one of the most revolutionary and insightful advanced analytics. For fans, coaches, and analysts of American soccer, understanding xG is no longer a luxury but a necessity, especially as we look towards the highly anticipated 2026 season and the World Cup on home soil.
Anúncios
This comprehensive guide aims to demystify xG in American soccer, providing a practical framework for interpreting this powerful metric. We’ll explore what xG is, how it’s calculated, why it matters for American teams and players, and how you can use it to gain a deeper understanding of the beautiful game. Whether you’re a seasoned analyst or a curious fan, this article will equip you with the knowledge to look beyond the scoreline and truly appreciate the underlying performance of teams in Major League Soccer (MLS), the US Men’s National Team (USMNT), and beyond.
What is Expected Goals (xG)? Unpacking the Core Concept
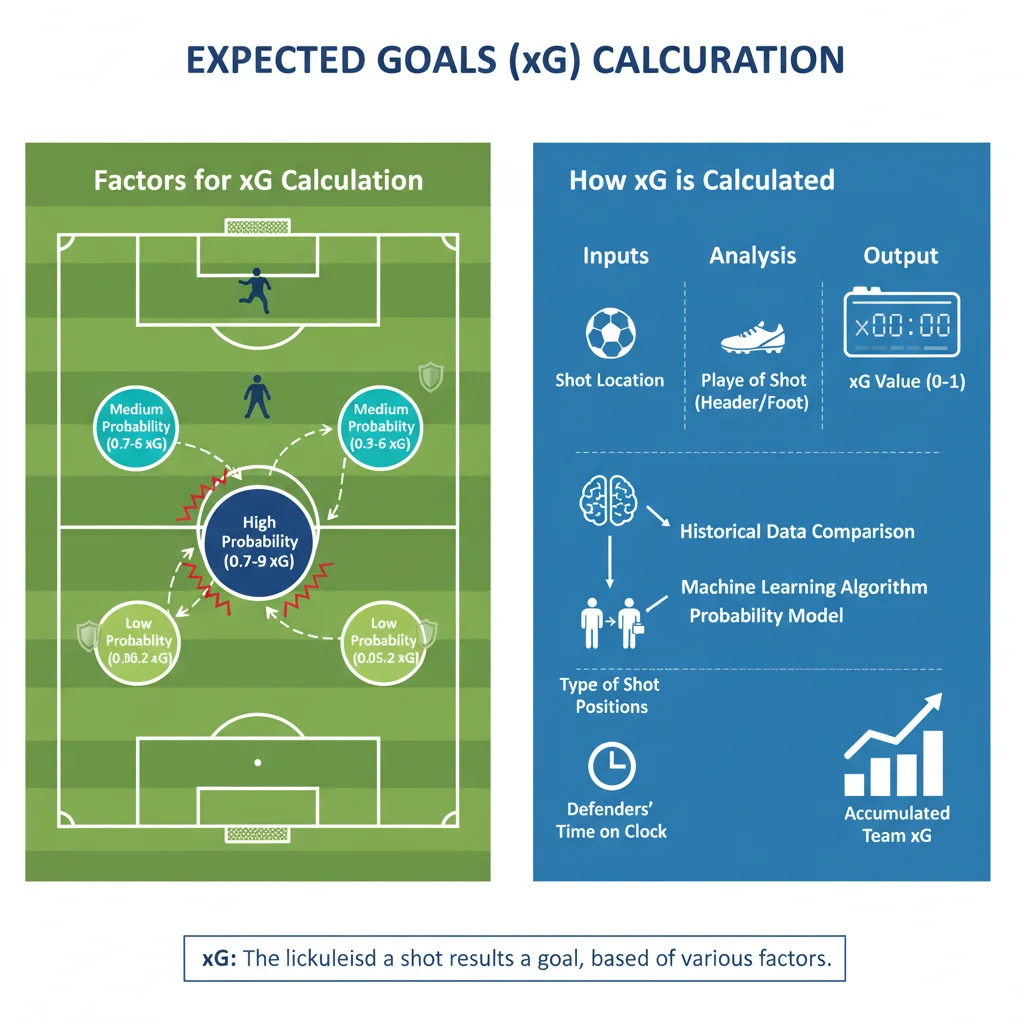
At its heart, Expected Goals (xG) is a statistical measure that quantifies the probability of a shot resulting in a goal, based on the characteristics of that shot and the events leading up to it. Unlike simple shot counts, xG doesn’t treat all shots equally. A shot from 30 yards out with defenders swarming has a much lower xG value than a tap-in from two yards with an open net, even though both count as ‘shots’ in traditional statistics.
Anúncios
The calculation of xG involves a sophisticated model that considers numerous factors. These typically include:
- Shot Location: Proximity to the goal and angle to the goal.
- Body Part: Header vs. foot.
- Type of Assist: Through ball, cross, cutback, dribble, etc.
- Defensive Pressure: Number of defenders between the shooter and the goal, and their proximity.
- Game State: Open play, set piece, penalty, fast break.
- Goalkeeper Position: Is the keeper out of position or blocking the angle?
- Previous Actions: Was it a rebound? Did it follow a dribble?
Each shot is assigned an xG value between 0 and 1, representing the likelihood of it being scored. For example, an xG of 0.10 means that, on average, a shot with those exact characteristics would be scored 10% of the time. Summing up all the xG values for a team’s shots in a game gives you their total Expected Goals for that match, offering a clearer picture of their attacking performance and the quality of chances created, irrespective of whether those chances were converted.
How xG Models Work: The Science Behind the Numbers
While the exact algorithms used by different data providers (like Opta, StatsBomb, Wyscout, etc.) vary, the core methodology for calculating xG remains consistent: they leverage historical data. Millions of past shots from thousands of games are fed into machine learning models. These models learn to identify patterns and assign probabilities based on the factors mentioned above.
When a new shot occurs in a live game, the model compares its characteristics to the vast database of similar past shots and assigns an xG value. It’s a predictive model that helps us understand the true offensive output of a team. A team that racks up 2.5 xG in a game has created chances that, statistically, should have resulted in 2.5 goals, regardless of whether they actually scored 0, 1, or 3 goals.
This distinction is crucial for understanding performance. A team that scores 3 goals from 1.0 xG might have been incredibly clinical or simply lucky, while a team that scores 0 goals from 2.5 xG might have been unlucky or had poor finishing, despite creating excellent opportunities. This is where the power of xG in American soccer truly shines, allowing for a more nuanced analysis.
Why xG Matters in American Soccer: Beyond the Scoreline
The beauty of xG lies in its ability to strip away the randomness and emotional swings of actual goal-scoring and reveal the underlying quality of play. For American soccer, where parity is often celebrated (e.g., in MLS) and international success is a constant aspiration (e.g., USMNT), xG offers invaluable insights.
1. Assessing True Performance
Did a team win 1-0 but get out-shot 20-5? Traditional stats might suggest they were lucky. xG provides a more precise answer. If the winning team had 0.8 xG and the losing team had 2.2 xG, it indicates the losing team created significantly better chances and was perhaps unlucky not to score. Conversely, a team that wins 3-0 with 1.5 xG might have been incredibly efficient or benefited from opposition errors. xG helps differentiate between good performance and good fortune.
2. Identifying Strengths and Weaknesses
By analyzing xG over several games, analysts can identify consistent patterns. A team with high xG for but low actual goals might have excellent chance creation but poor finishing. A team with low xG against but high actual goals conceded might have an unlucky goalkeeper or make critical defensive errors that lead to high-value shots. This granularity helps coaches tailor training and recruitment strategies.
3. Player Evaluation
xG isn’t just for teams; it’s also applied to individual players. ‘xG per shot,’ ‘xG assisted,’ and ‘xG chain’ (measuring a player’s involvement in moves leading to shots) are metrics used to evaluate offensive contributions beyond just goals and assists. A striker who consistently generates high xG but doesn’t score might be due for a goal-scoring surge, or perhaps needs to work on their finishing. This is vital for scouting and player development in MLS academies and for the USMNT pool.
4. Predicting Future Outcomes
While xG isn’t a crystal ball, it’s a better predictor of future performance than actual goals. Teams that consistently outperform their xG (score more than expected) often regress to the mean over time, and vice versa. This makes xG an invaluable tool for sports bettors and fantasy soccer managers looking for an edge in American soccer leagues.
5. Tactical Insights
Coaches use xG to understand where their team is creating chances, how they are creating them, and where they are conceding them. Are most of their high xG shots coming from set pieces? Are they struggling to generate quality chances from open play? Is their defensive scheme allowing opponents too many shots from dangerous areas? These insights inform tactical adjustments and game planning.
Interpreting xG Data for the 2026 Season: A Practical Approach
As American soccer gears up for the 2026 World Cup, the focus on data-driven performance analysis will only intensify. Here’s how you can practically interpret xG data to enhance your understanding of the upcoming seasons in MLS and the USMNT’s journey:
1. xG vs. Actual Goals: The Performance Gap
This is the most fundamental comparison. If a team’s ‘Goals For’ (GF) is significantly higher than their ‘Expected Goals For’ (xGF) over a sustained period, they might be overperforming. This could be due to exceptional finishing, fortunate deflections, or unsustainable luck. Conversely, if GF is much lower than xGF, they might be underperforming, indicating poor finishing or bad luck. Look for teams whose xGF is consistently high but GF is low – they might be primed for a positive correction.
Similarly, compare ‘Goals Against’ (GA) with ‘Expected Goals Against’ (xGA). If GA is much lower than xGA, their goalkeeper might be having an exceptional season, or their defense is making crucial blocks. If GA is higher than xGA, they might be conceding from low-quality shots, indicating defensive lapses or unlucky bounces.
2. Shot Maps and xG Values
Don’t just look at aggregate xG numbers. Dive into shot maps. These visualizations show the location and xG value of every shot taken in a game. They can reveal patterns: Is a team taking too many low-xG shots from outside the box? Are they consistently getting into high-xG areas but failing to convert? This visual data is incredibly powerful for understanding attacking and defensive strategies in xG in American soccer contexts.
3. xG Difference (xGD)
Just like goal difference, xG Difference (xGD = xGF – xGA) is a strong indicator of a team’s overall quality. A positive xGD means a team is creating better chances than they are conceding, which is generally a sign of a strong team. Teams with high xGD are typically title contenders or playoff teams, even if their actual goal difference doesn’t always reflect it due to variance.
4. xG per Shot and xG per Shot Conceded
These metrics offer insight into the quality of chances a team creates and concedes. A high xG per shot indicates a team is generating high-quality opportunities. A low xG per shot conceded suggests a strong defense that limits opponents to difficult shots. These are crucial for evaluating tactical effectiveness.
5. Post-Shot xG (PSxG)
A more advanced metric, Post-Shot xG (PSxG), takes into account where the shot actually ends up on target. It evaluates the quality of the shot after it has been struck, giving better insight into goalkeeper performance. If a goalkeeper’s actual goals conceded is significantly lower than their PSxG faced, it suggests they are making exceptional saves. This is particularly useful for evaluating the elite shot-stoppers in MLS and for the USMNT.

xG in MLS: Analyzing the Domestic Landscape
MLS, with its single-entity structure, salary cap, and emphasis on youth development, presents a unique environment for xG analysis. The league’s parity often means fine margins determine playoff spots and championship contention. Understanding xG in American soccer, specifically within MLS, can provide a significant advantage.
- Identifying Underperformers/Overperformers: In a league where teams can quickly rise and fall, xG helps identify which teams are genuinely good but unlucky, or vice versa. A team with a strong xGD but poor league position might be a savvy bet for a turnaround.
- Player Recruitment: MLS teams are increasingly using xG and other advanced metrics in their scouting. Identifying players who consistently generate high xG in their previous leagues or who have a high xG per shot can be crucial for finding undervalued talent.
- Playoff Predictions: Teams with consistently high xGD often perform well in the playoffs, as their underlying quality eventually shines through.
xG and the USMNT: Building for 2026
The US Men’s National Team faces immense pressure and expectation as hosts of the 2026 World Cup. xG analysis will be a critical tool in their preparation and performance evaluation.
- Tactical Adjustments: The coaching staff can use xG data from international friendlies and competitive matches to assess if their tactical setup is creating high-quality chances against top-tier opposition and if their defensive structure is limiting opponents to low-xG shots.
- Player Selection: Evaluating players based on their xG contributions (both offensively and defensively) in their respective club environments and for the national team can help make informed selection decisions, especially in tight positional battles.
- Tournament Performance: In a tournament setting like the World Cup, where luck can play a significant role in individual matches, xG can help assess the USMNT’s underlying performance regardless of individual game outcomes, providing a more stable measure of progress and potential.
Limitations and Nuances of xG: A Balanced Perspective
While xG is a powerful tool, it’s not without its limitations. It’s important to remember that xG is a model, and like all models, it’s an approximation of reality. Some nuances to consider:
- Contextual Factors: xG models typically don’t account for every single contextual detail. For example, a shot taken by a player with exceptional long-range shooting ability might have a low xG, but a higher actual probability for that specific player.
- Defensive Errors Not Leading to Shots: xG only measures the quality of shots. It doesn’t capture defensive errors that break down an attack before a shot can be taken, or incredible defensive blocks that prevent a high-xG shot.
- Pass Quality: While some xG models incorporate the type of assist, they don’t fully capture the ‘unplayable’ nature of a perfect pass that puts a striker in an even better position than the raw location might suggest.
- Player Skill: xG is an average. Elite finishers might consistently outperform their xG, while poor finishers might consistently underperform. While this ‘finishing skill’ can be measured by comparing actual goals to xG, the xG value itself doesn’t inherently factor in the shooter’s individual prowess.
Therefore, xG should always be used in conjunction with other metrics, video analysis, and expert eye-test observations. It’s a piece of the puzzle, not the entire picture.
The Future of xG in American Soccer Analytics
The evolution of xG in American soccer is far from over. As data collection becomes more sophisticated (e.g., player tracking data, optical tracking), xG models will continue to improve, incorporating even more granular details like player speed, body orientation, and even the trajectory of the ball. We can expect to see more advanced derivatives of xG, such as xG Chain, xG Build-up, and Expected Assists (xA), becoming standard in mainstream discussions.
For fans, this means an even richer viewing experience, allowing for deeper tactical understanding and more informed debates. For coaches and technical directors, it provides an ever-sharpening lens through which to evaluate performance, develop talent, and gain a competitive edge. The 2026 World Cup will undoubtedly serve as a major catalyst for the further adoption and innovation of these advanced analytics in the American game.
Conclusion: Embracing Advanced Analytics for a Deeper Understanding
Expected Goals (xG) has fundamentally changed how we analyze soccer. For American soccer, it offers a powerful and objective lens to assess performance, identify trends, and predict future outcomes in MLS, the USMNT, and youth development. By moving beyond traditional statistics, xG allows us to appreciate the true quality of chances created and conceded, distinguishing between genuine performance and mere luck.
As we march towards the 2026 season and the monumental event of the World Cup on American soil, a solid understanding of xG in American soccer will be an indispensable tool for anyone looking to truly understand the beautiful game. Embrace these advanced analytics, and you’ll find yourself not just watching soccer, but truly understanding it, gaining insights that were once the exclusive domain of professional analysts. The future of soccer analysis is here, and xG is leading the charge.