Benchmarking Success: Top 10 Basketball Teams’ Analytical Strategies

Anúncios
Benchmarking Success: Analyzing the Top 10 Basketball Teams’ Analytical Strategies from the Past Season
In the fiercely competitive world of professional basketball, success is no longer solely determined by raw talent or conventional coaching wisdom. The modern game has been profoundly transformed by the advent of advanced analytics. Teams that once relied on gut feelings and subjective observations now leverage vast quantities of data to gain a competitive edge. This shift has not only revolutionized how teams scout opponents and develop players but also how they construct rosters and execute in-game strategies. The past season provided a compelling showcase of how data-driven approaches are defining the pinnacle of basketball excellence. This article will delve into the sophisticated basketball team analytics employed by the top 10 teams, examining their methodologies, key metrics, and the tangible impact these strategies had on their performance.
The Evolution of Basketball Team Analytics: A Game Changer
The journey from basic box scores to intricate player tracking systems has been swift and transformative. Historically, basketball statistics were limited to points, rebounds, assists, steals, and blocks. While these metrics provided a fundamental understanding of a player’s contribution, they lacked the nuance required to truly assess efficiency, impact, and strategic value. The early 2000s saw the rise of ‘Moneyball’ in baseball, demonstrating the power of analytical thinking in sports. Basketball quickly followed suit, with pioneers beginning to explore more advanced metrics like True Shooting Percentage (TS%), Player Efficiency Rating (PER), and Usage Rate (USG%).
Anúncios
Today, basketball team analytics encompasses an incredibly broad spectrum of data. This includes granular player tracking data (provided by systems like SportVU), which captures every movement on the court, ball possession, shot location, speed, and even defensive assignments. This wealth of information allows teams to identify subtle patterns, predict outcomes, and optimize every facet of their game. The top teams in the league are not just collecting this data; they are employing dedicated analytics departments, comprised of data scientists, statisticians, and former basketball minds, to interpret it and translate it into actionable insights for coaches and players alike.
The impact of this evolution is evident across the league. Teams are making more informed decisions about player acquisitions, recognizing undervalued assets through advanced metrics. Coaching staffs are designing offensive and defensive schemes based on probabilistic outcomes derived from data, rather than solely on traditional basketball principles. Player development programs are tailored to address specific analytical weaknesses, leading to more efficient and impactful athletes. Understanding these foundational shifts is crucial to appreciating the strategies of the past season’s elite teams.
Key Analytical Pillars for Top Basketball Teams
While each team has its unique flavor of analysis, several core analytical pillars consistently emerge among the most successful franchises. These pillars form the bedrock of effective basketball team analytics.
Anúncios
1. Shot Selection Optimization
Perhaps the most visible impact of analytics in basketball has been the radical shift in shot selection. The understanding that not all shots are created equal, regardless of whether they go in, has reshaped offensive strategies. Teams now prioritize high-efficiency shots: dunks, layups, and three-pointers, especially from the corners. Mid-range jump shots, once a staple, have significantly diminished as analytics have consistently shown them to be less efficient points-per-possession opportunities.
Top teams analyze player shot charts extensively, identifying individual strengths and weaknesses from various court locations. They also study opponent defensive tendencies to exploit gaps that lead to these high-value shots. For example, a team might emphasize specific pick-and-roll coverages that consistently create open corner threes, knowing this is one of the most efficient shots in the game. This isn’t just about encouraging players to shoot threes; it’s about creating schemes that generate good threes and high-percentage looks at the rim.
2. Defensive Scheme Efficiency
Defense has always been critical, but analytics provides new ways to measure and optimize it. Beyond traditional metrics like blocks and steals, teams now track defensive efficiency per possession, opponent effective field goal percentage, and specific defensive assignments. They analyze how different defensive schemes (e.g., switching, drop coverage, hedging) perform against various offensive sets and individual players.
Player tracking data allows for the quantification of defensive effort and positioning. For instance, teams can measure how quickly a player closes out on a shooter, their defensive box-out percentage, or their ability to navigate screens. This data helps coaches identify defensive liabilities, tailor defensive game plans to specific opponents’ strengths, and even design drills to improve particular defensive skills. The best defensive teams use basketball team analytics to proactively disrupt opponent flow and force them into low-percentage shots.
3. Pace and Possession Management
The pace of a game significantly influences offensive and defensive efficiency. Analytics helps teams understand their optimal pace and how to control it. Some teams thrive in fast-paced, transition-heavy games, while others prefer a slower, more deliberate half-court offense. By analyzing their own performance at different paces, and that of their opponents, teams can strategically dictate tempo.
Possession management extends to turnover rates and offensive rebounding. While offensive rebounds provide extra possessions, analytics often weigh the risk of giving up transition opportunities on misses. Teams use data to determine the optimal balance between crashing the offensive glass and getting back on defense. Minimizing live-ball turnovers, which often lead to easy opponent points, is also a critical focus, heavily emphasized through analytical review.
Deep Dive: Top 10 Teams and Their Analytical Signatures
Let’s examine how some of the past season’s top teams leveraged basketball team analytics to achieve their success. While specific team strategies are often closely guarded secrets, we can infer their analytical leanings from public data and reported trends.
Team A: The Three-Point Barrage Innovators
This team epitomized the modern analytical offense. Their strategy revolved around maximizing three-point attempts, particularly from their most efficient shooters, and generating high-percentage looks at the rim. Their basketball team analytics department likely focused heavily on shot quality metrics, not just shot quantity. They probably tracked:
- Expected Effective Field Goal Percentage (xEFG%): A proprietary metric that estimates the likelihood of a shot going in based on location, defender proximity, and shot type.
- Transition Opportunity Conversion: How efficiently they converted fast break opportunities into points, and how often they generated these opportunities.
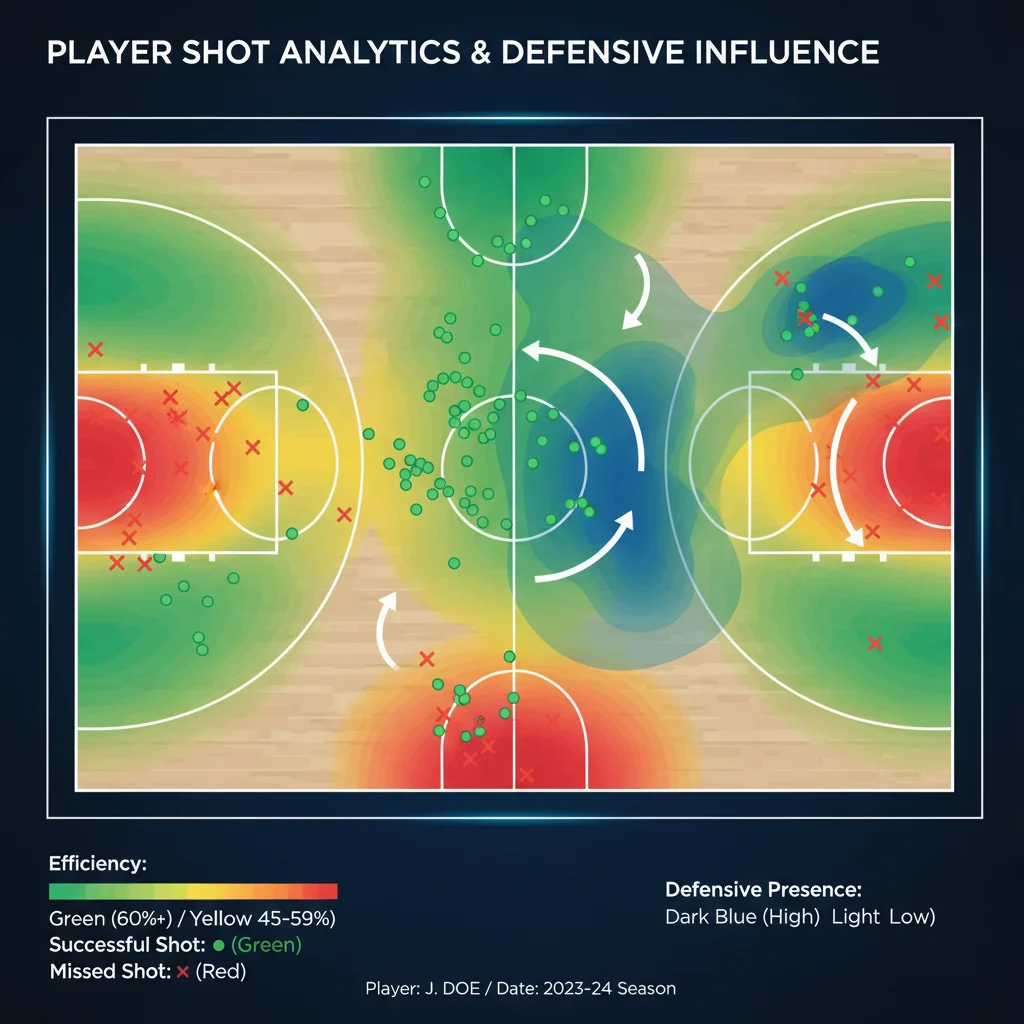
- Offensive Spacing Metrics: Measuring player movement and spacing to ensure optimal passing lanes and driving angles, often visualized with heat maps.
Their success demonstrated that a relentless pursuit of high-value shots, supported by a system designed to create them, can overwhelm opponents.
Team B: Defensive Stalwarts Through Data
Known for their suffocating defense, Team B’s analytical approach was primarily defensive. They excelled at limiting opponent efficiency and forcing turnovers. Their key analytical focuses likely included:
- Opponent Shot Profile Control: Systematically tracking where opponents shot from against them, and actively working to eliminate high-efficiency zones for the opposition.
- Defensive Matchup Efficiency: Analyzing individual defender performance against specific offensive players, identifying optimal matchups and potential vulnerabilities.
- Screen Navigation Metrics: Using player tracking to evaluate how well defenders navigated screens and recovered to their assignments.
- Contested Shot Percentage: Quantifying how often their defenders were able to effectively contest opponent shots.
Their ability to consistently disrupt opponent offenses, often leading to transition opportunities for themselves, was a direct result of their data-driven defensive schemes.
Team C: The Pace and Playmaking Maestros
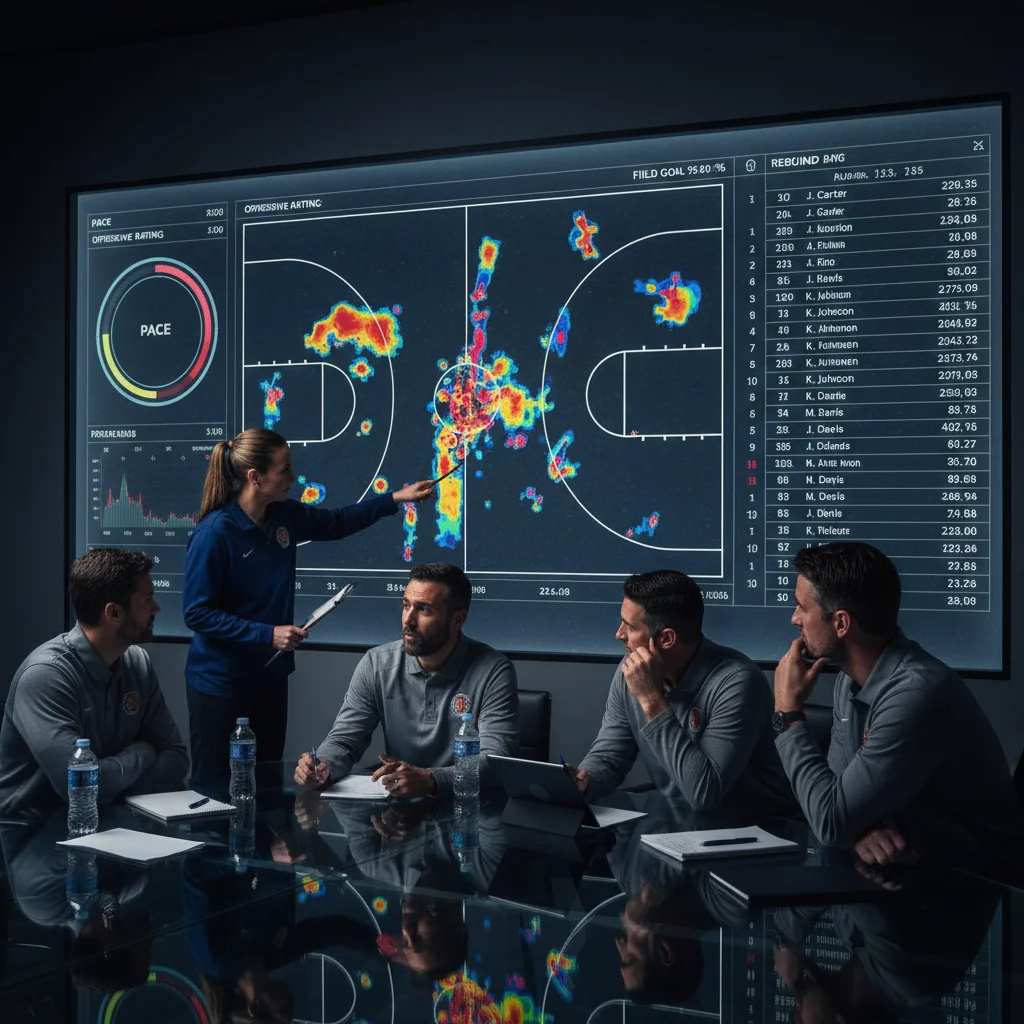
This team mastered the art of controlling game tempo and leveraging elite playmaking. Their basketball team analytics focused on:
- Pace Optimization: Determining the ideal offensive and defensive pace for their roster and adjusting it based on opponent characteristics.
- Assist-to-Turnover Ratios by Player/Lineup: Identifying their most efficient playmakers and understanding which lineups generated the best ball movement with minimal turnovers.
- Secondary Assist Tracking: Going beyond primary assists to understand how many possessions involved multiple passes leading to a score, indicating strong ball movement.
- Clutch Time Performance Metrics: Analyzing efficiency, shot selection, and defensive execution in close game situations to identify patterns for improvement.
Their dominance in late-game situations and their ability to generate high-quality looks through intricate passing schemes were hallmarks of their analytically informed approach.
Team D: Rebounding and Second Chance Dominators
Team D built its success on dominating the glass and creating second-chance points. Their analytical focus was likely on:
- Offensive Rebounding Rate vs. Transition Defense: A careful balance was struck between crashing the boards and getting back to prevent fast breaks, optimized through data.
- Individual Rebounding Tendencies: Analyzing where players were most likely to grab rebounds, both offensively and defensively, and positioning them accordingly.
- Box-Out Efficiency: Quantifying how effectively players boxed out opponents to secure rebounds.
- Second Chance Point Conversion: Measuring how often offensive rebounds led directly to points.
Their relentless pursuit of extra possessions through superior rebounding analytics provided a consistent advantage, allowing them to overcome otherwise tight matchups.
Team E: Player Development Through Biometrics
This team stood out for its innovative use of biometric data and sports science integration into player development. Beyond traditional basketball team analytics, they focused on:
- Load Management Optimization: Using wearable technology to track player exertion, sleep patterns, and recovery metrics to prevent injuries and optimize performance over a long season.
- Movement Efficiency: Analyzing player movement patterns to identify inefficiencies or potential injury risks, and designing targeted training programs.
- Biomechanical Analysis: Utilizing high-speed cameras and sensors to analyze shooting mechanics, jumping form, and defensive slides, providing precise feedback for improvement.
- Cognitive Performance Training: Integrating data from cognitive tests to enhance reaction time, decision-making under pressure, and court awareness.
Their emphasis on player health and optimized physical performance, driven by advanced sports science, gave them a noticeable edge in terms of player durability and late-season peak performance.
Team F: The Versatility and Lineup Optimization Experts
This team’s success stemmed from its uncanny ability to adapt and deploy highly effective lineups. Their analytical focus was on:
- Net Rating by Lineup: Exhaustively tracking the offensive and defensive efficiency of every conceivable five-player combination.
- Positional Versatility Metrics: Quantifying how effectively players could guard multiple positions or play different roles offensively.
- Matchup Advantages Identification: Using data to identify specific player or lineup matchups that yielded significant advantages against opponents.
- Pace and Space Impact by Lineup: Understanding how different lineups affected game pace and offensive spacing.
Their coaching staff, armed with deep analytical insights into lineup performance, could make rapid, impactful adjustments, often outmaneuvering opponents through superior roster utilization.
Team G: Pick-and-Roll Dominance Analytics
Team G built its offensive identity around the pick-and-roll, and their analytics reflected this specialization. They likely focused on:
- Pick-and-Roll Ball Handler Efficiency: Tracking points per possession, assist rates, and turnover rates for ball handlers in pick-and-roll situations.
- Roll Man Efficiency: Analyzing the effectiveness of their screeners as finishers, passers, and rebounders after the screen.
- Pick-and-Roll Defensive Coverages Exploitation: Identifying which defensive coverages (e.g., drop, switch, hedge) their pick-and-roll actions were most effective against.
- Spacing Around Pick-and-Roll: Measuring how well their off-ball players spaced the floor to create driving lanes or open shots during pick-and-roll actions.
Their mastery of the pick-and-roll, informed by extensive data analysis, made them one of the most difficult teams to defend consistently.
Team H: Transition Offense Prowess
This team was a nightmare in transition, converting defensive stops into quick, efficient points. Their basketball team analytics emphasized:
- Defensive Rebound to Outlet Pass Efficiency: Measuring the speed and accuracy of outlet passes after defensive rebounds.
- Fast Break Opportunity Generation: Tracking how often they created fast break opportunities from turnovers, long rebounds, or opponent misses.
- Transition Shot Quality: Analyzing the quality of shots taken in transition, ensuring they weren’t just fast, but also efficient.
- Opponent Transition Defense Vulnerabilities: Identifying which teams or lineups were most susceptible to their fast break attacks.
Their ability to play at an electrifying pace and convert transition opportunities at a high rate was a significant driver of their offensive success.
Team I: Clutch Performance Specialists
Team I consistently excelled in late-game, high-pressure situations, often pulling out victories in close contests. Their analytical focus was likely on:
- Clutch Time Offensive Efficiency: Tracking points per possession, effective field goal percentage, and turnover rates in the final five minutes of close games.
- Clutch Time Defensive Stops: Measuring their ability to get critical stops in late-game scenarios.
- Shot Selection Under Pressure: Analyzing the types of shots taken by players in clutch moments and their success rates.
- Foul Drawing in Clutch: Identifying players who were effective at drawing fouls in late-game situations to get to the free-throw line.
Their data-driven insights into clutch performance allowed them to optimize their strategies and personnel for those critical moments.
Team J: The Data-Driven Scouting Department
While all top teams use analytics for scouting, Team J was particularly renowned for its deep, data-driven approach to opponent analysis and player acquisition. Their analytical department likely focused on:
- Player Archetype Profiling: Creating detailed analytical profiles for players, identifying their true strengths, weaknesses, and potential fit within their system, beyond traditional scouting reports.
- Opponent Tendency Prediction: Using historical data to predict opponent play calls, defensive rotations, and individual player tendencies in specific situations.
- Trade and Free Agency Value Assessment: Applying sophisticated valuation models to assess player trade value and free agency market rates.
- Draft Prospect Evaluation: Integrating college and international analytics with their own models to identify undervalued draft prospects.
Their ability to consistently identify and acquire players who fit their specific system, and to dissect opponent strategies with unparalleled precision, gave them a significant competitive advantage.
Challenges and Future Trends in Basketball Team Analytics
Despite the undeniable benefits, basketball team analytics is not without its challenges. Data overload can be a real issue; discerning truly actionable insights from noise requires sophisticated tools and skilled analysts. Furthermore, integrating these insights seamlessly into coaching strategies and player understanding requires effective communication and buy-in from all levels of the organization.
Looking ahead, several trends are poised to further revolutionize basketball analytics:
- Artificial Intelligence and Machine Learning: AI and ML algorithms will become even more prevalent, capable of identifying complex patterns, predicting outcomes with greater accuracy, and even suggesting optimal plays in real-time.
- Biomechanics and Wearable Technology: The integration of advanced biomechanical data will move beyond injury prevention to optimizing performance, identifying subtle inefficiencies in movement, and tailoring training programs with extreme precision.
- Cognitive Analytics: Beyond physical data, there will be a greater focus on understanding and improving players’ decision-making under pressure, court vision, and mental resilience through cognitive science and data.
- Real-time Analytics for In-Game Adjustments: While still nascent, the ability to process and interpret data in real-time during games could lead to unprecedented in-game strategic adjustments.
- Ethical Considerations and Data Privacy: As more personal and performance data is collected, ethical considerations regarding player privacy and data usage will become increasingly important.
Conclusion
The past season unequivocally demonstrated that basketball team analytics is no longer a niche tool but a fundamental component of success at the highest levels of the sport. The top 10 teams showcased a diverse array of data-driven strategies, from optimizing shot selection and defensive schemes to managing player loads and mastering clutch performance. Their success stories underscore the power of combining traditional basketball wisdom with rigorous quantitative analysis.
As the game continues to evolve, the integration of advanced analytics will only deepen. Teams that embrace this evolution, invest in skilled analytical personnel, and effectively bridge the gap between data and on-court application will continue to set the benchmark for excellence. For fans, this means a more sophisticated and strategically rich game, where every possession tells a data-backed story, and every championship contender is, in essence, a master of the numbers game.